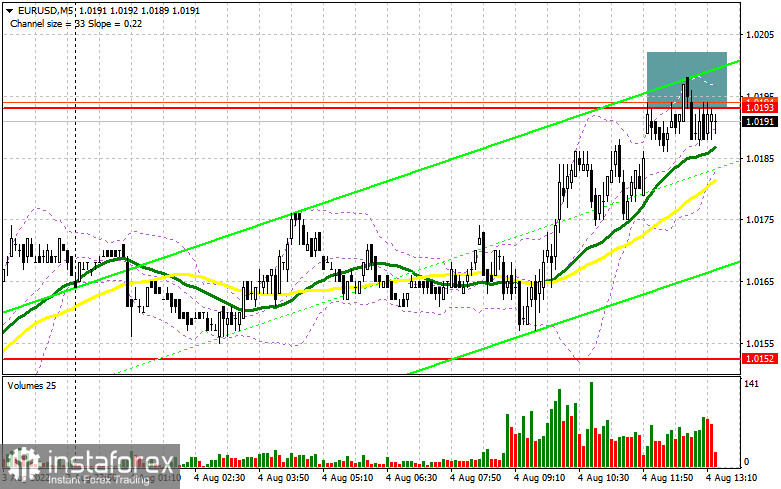
In my morning forecast, I paid attention to the level of 1.0152 and decided to enter the market. Let's look at the 5-minute chart and figure out what happened there. As a result of the morning movement of the euro down to the area of 1.0152, literally 5 points were not enough before the test. For this reason, getting a good buy signal was impossible. Then the pair grew to 1.0193, but it also failed to break above this range. A false breakdown on it has already given a sell signal, but, as you can see, the bears are in no hurry to return to the market. It indicates the likelihood of a larger correction.
To open long positions on EURUSD, you need:
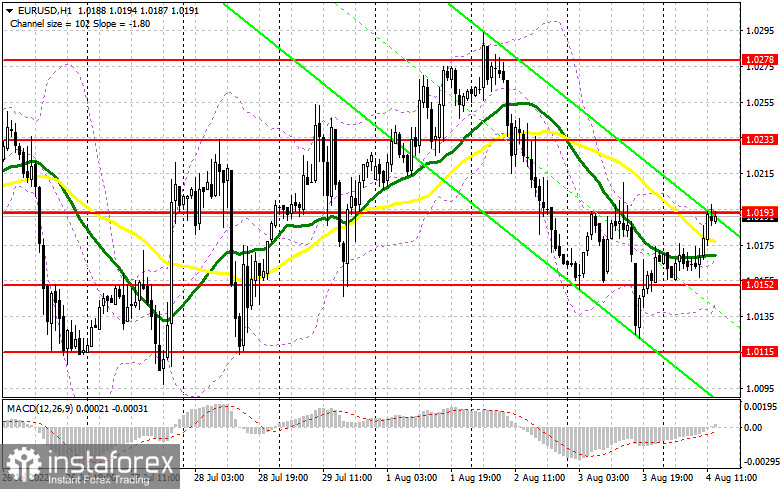
For the second half of the day, the technical picture has not changed in any way. However, more interesting fundamental statistics are expected for the US, which may lead to a surge in market volatility. We should not forget about the Bank of England's decision on interest rates, which, although indirectly, can affect the direction of all risky assets, including the euro. The weekly number of initial applications for unemployment benefits in the US is likely to coincide with economists' forecasts, which cannot be said about the foreign trade balance: export growth will positively impact the US dollar and its exchange rate. FOMC member Loretta Mester's speech and her hawkish view on monetary policy will be an additional plus for the dollar. If the pair declines after strong US data, only the formation of a false breakdown around 1.0152, from which the euro has already bounced up today, will give another signal to open long positions in the hope of building an upward trend with the prospect of updating the resistance of 1.0193. A breakout and a top-down test of this range will hit the bears' stop orders, forming an additional signal to enter long positions with the possibility of a larger upward movement to 1.0233. The farthest target will be the 1.0278 area, where I recommend fixing the profits. If EUR/USD declines and there are no buyers at 1.0152, the pressure on the pair will increase, opening the way to the lower border of the 1.0115 side channel. The best option for opening long positions would be a false breakdown at this level. I advise buying EUR/USD immediately for a rebound only from 1.0082, or even lower – around 1.0045 with an upward correction of 30-35 points within a day.
To open short positions on EURUSD, you need:
Sellers coped with the task: they tried to fail the pair below 1.0152 and managed to protect 1.0193. However, there is no support from major players, so it is possible that during the American session, the bears will still miss 1.0193, but this will happen in the event of a sharp jerk of the British pound up and a positive reaction to the decision of the Bank of England. Until the moment when trading is conducted below this range, you can count on a repeated decline in the euro. A good option for sale will be another false breakdown in the nearest resistance area of 1.0193, which can be formed after strong statistics on the foreign trade balance. All this will lead to a repeated euro movement down to the 1.1052 area.Moreover, a breakdown and consolidation below this range and a reverse test from the bottom up will form an additional sell signal with the demolition of buyers' stop orders and a larger pair movement to the 1.0115 area. Fixing below this area is a direct road to 1.0082, where I recommend completely exiting sales. A more distant target will be the 1.0045 area. In case of an upward movement of EUR/USD during the American session and the absence of bears at 1.0193, I advise you to postpone short positions to 1.0233, where the moving averages are. The formation of a false breakout there will become a new starting point for entering short positions. It is possible to sell EUR/USD immediately for a rebound from this month's maximum around 1.0278, or even higher – from 1.0323 with the aim of a downward correction of 30-35 points.
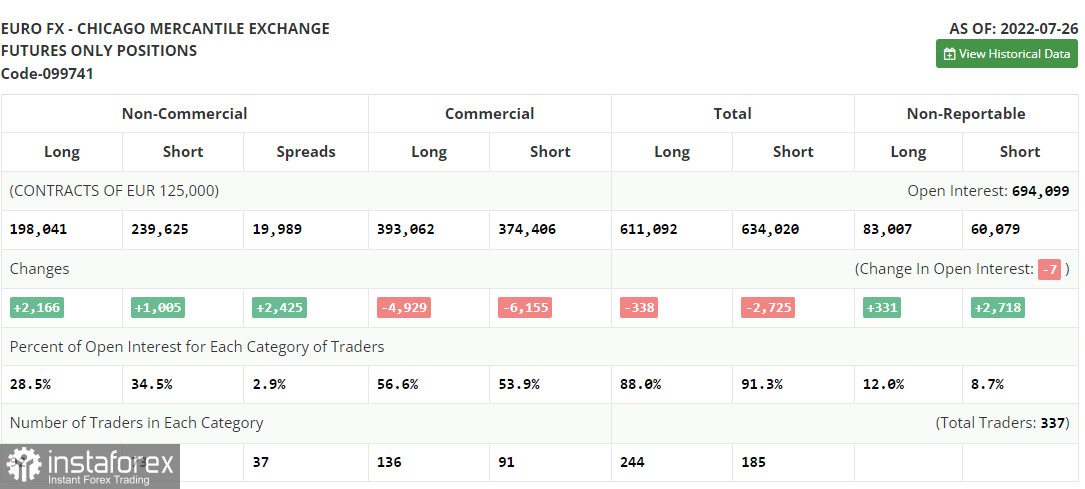
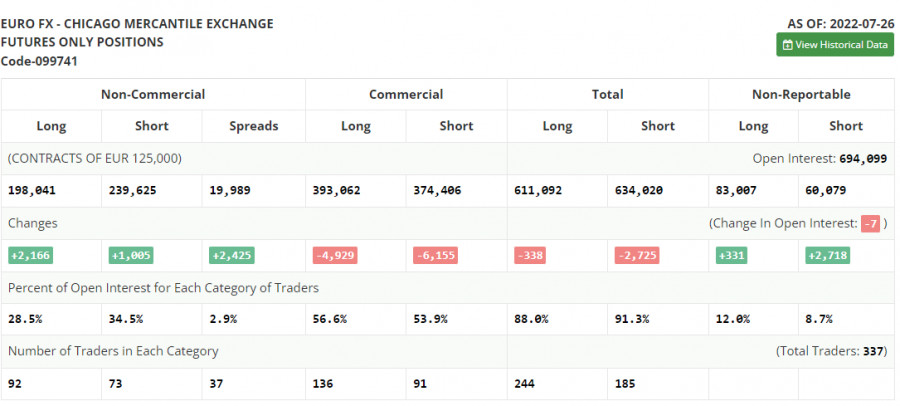
The COT report (Commitment of Traders) for July 26 recorded an increase in both short and long positions, but the former turned out to be more, which indicates the gradual end of the bear market and an attempt to find the market bottom after reaching the parity of the euro against the US dollar. The data released last week on the European economy helped the European currency somewhat. A slight acceleration in the growth of the consumer price index was offset by a sharp upward jerk of the European economy in the 2nd quarter of this year. GDP growth of 4.0% per annum surprised many economists, which supported the bullish mood of traders after the Federal Reserve hinted at a possible softer further cycle of interest rate hikes. All this will allow us to count on the further upward movement of the EUR/USD pair. The COT report indicates that long non-commercial positions increased by 2,166 to 198,041, while short non-commercial positions jumped by 1,005 to 239,625. At the end of the week, the total non-commercial net position, although it remained negative, increased slightly — from -42,745 to -41,584. The weekly closing price decreased to 1.0161 against 1.0278.
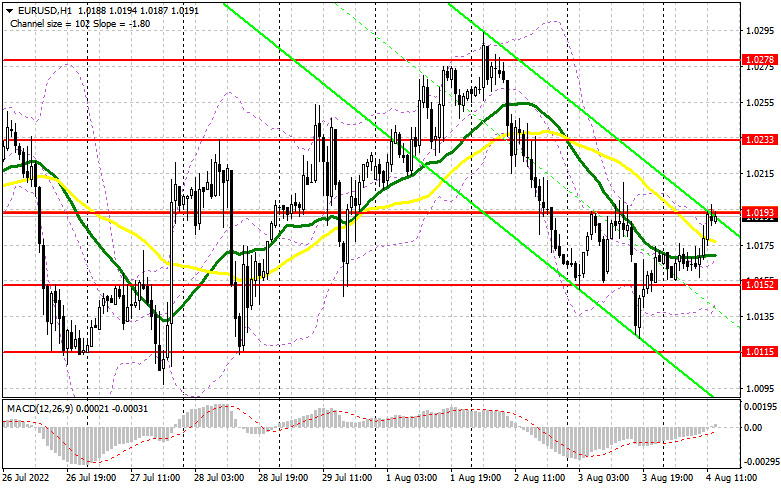
Signals of indicators:Moving AveragesTrading is conducted around the 30 and 50-daily moving averages, which indicates market uncertainty.Note. The author considers the period and prices of moving averages on the hourly chart H1 and differ from the general definition of the classic daily moving averages on the daily chart D1.Bollinger BandsIn the case of growth, the upper limit of the indicator around 1.0200 will act as resistance. In case of a decline, the lower limit of the indicator in the area of 1.0145 will act as support.Description of indicators
- Moving average (moving average determines the current trend by smoothing out volatility and noise). Period 50. The graph is marked in yellow.
- Moving average (moving average determines the current trend by smoothing out volatility and noise). Period 30. The graph is marked in green.
- MACD indicator (Moving Average Convergence / Divergence - moving average convergence/divergence) Fast EMA period 12. Slow EMA period 26. SMA period 9
- Bollinger Bands (Bollinger Bands). Period 20
- Non-profit speculative traders, such as individual traders, hedge funds, and large institutions use the futures market for speculative purposes and to meet certain requirements.
- Long non-commercial positions represent the total long open position of non-commercial traders.
- Short non-commercial positions represent the total short open position of non-commercial traders.
- Total non-commercial net position is the difference between the short and long positions of non-commercial traders.